Scrubber
Scrubber is program designed to clean-up biosensor data. It can align data and remove artifacts prior to analysis. Using Scrubber you can go from raw data to binding data with just a few mouse clicks.
Functions
The program is arranged as a series of pages with each page performing a specific function.
- Data
- Loads data from a file.
- The program can read blr and bls files created by a BIACORE® biosensor. It can also read text files exported from analysis programs or from spreadsheets such as Excel.
- Zero
- Zeros the response of each curve before injection.
- Align
- Aligns the injection time of the curves and sets them to zero.
- DMSO
- Corrects for the effect of including DMSO or other high refractive index compounds in the sample buffer.
- Blank
- Subtracts blank injections from the data curves to remove injection artifacts.
- Fit
- Calculates binding constants from the response at different concentrations.
- Kinetics
- With Scrubber version 2 you can now fit the data to get values for rate constants with the click of a button.
- You can choose from three models to fit:
- Dissociation
- gives dissociation rate constant (kd).
- Simple
- gives association (ka) and dissociation (kd) rates and KD.
- Mass transport limited
- gives mass transport rate (km) and ka and kd.
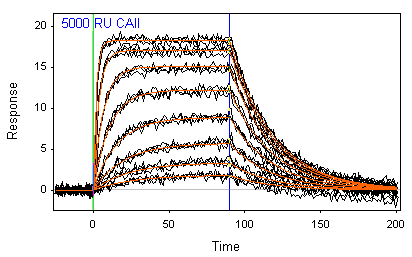
 In this graph you can see a fit of simple interaction model (in red) to measured data (in black). The table shows the results of the analysis along with the error in the estimate. There is also the option to fit the start and stop times and a bulk refractive index change during injection.
Frequently asked questions
Q: What sytems does the program run on?
A: Scrubber runs on Windows XP and later. There is an updated version that has a 32 bit (XP) and 64 bit (Windows 7 and later) versions.
Q: What do those numbers in parentheses in the results
mean?
A: In the table above the ka is shown as 4.67(2)e4. The (2) is the standard deviation of the result as determined from the fit. It is shown as the error in the last digit of the result.
So, 0.00349(7) = 0.00349 +/- 0.00007
And 1.23(4) e6 = 1.23 e6 +/- 0.04 e6
The error is rounded to one digit then the result is rounded to the same number of significant digits. If you ever see something like 0(4) then the error was bigger than the result.
The error is derived from the diagonal of the covariance matrix resulting from the fit and generally shows how well that parameter is specified by the data.
References
Integration - ka,kd
O’Shannessy, D. J., Brighamburke, M., Soneson, K. K., Hensley, P., and Brooks, I. (1993) Determination of rate and equilibrium binding constants for macromolecular interactions using surface plasmon resonance: use of nonlinear least squares analysis methods, Anal. Biochem. 212, 457-468.
Integration - km,ka,kdK. Sigmundsson, G. Másson, R. Rice, N. Beauchemin and B. Öbrink. (2002) Determination of active concentrations and association/dissociation rate constants of interacting biomolecules: An analytical solution to the theory for kinetic and mass transport limitations in biosensor technology and its experimental verification. Biochemistry 41(26), 8263-8276.
DMSO correctionFrostell-Karlsson, A. , Remaeus, A. , Roos, H. , Andersson, K. , Borg, P. , Hamalainen, M. & Karlsson, R. (2000) Biosensor analysis of the interaction between immobilized human serum albumin and drug compounds for prediction of human serum albumin binding levels. J. Med. Chem. 43, 1986-1992.
Curve fittingPress, W. H., Teukolsky, S. A., Vetterling, W. T., and Flannery, B. P. (1992) Numerical recipes in C: the art of scientific computing - 2nd ed. Cambridge University Press.